In the context of the SAV+R project, the Metalab worked with Centech with the goal of studying and describing acoustics of the reception hall, located at the center of the building. Generally speaking, closed spaces have different acoustic signatures, since sound does not resonate the same way in a church, an office or a bathroom. The space shape, the type of dividers and the various elements found on location contribute to a unique sound signature.
First, we will present the variety of tools and techniques used in characterizing the space under the Centech dome. Following this characterization, we will make a proposal for a simple solution whose goal is to help reduce the space’s reverberation.
It’s also an opportunity to explore the interest in using an ambisonic recording for analyzing an impulse response.
About the Centech
The Centech is the incubator of the École de technologie supérieure (ETS), both located in Montréal. Installed inside the former Montréal’s Dow Planetarium, this space benefits from an exceptional architecture: a reinforced concrete dome layered above a cylinder of the same material.
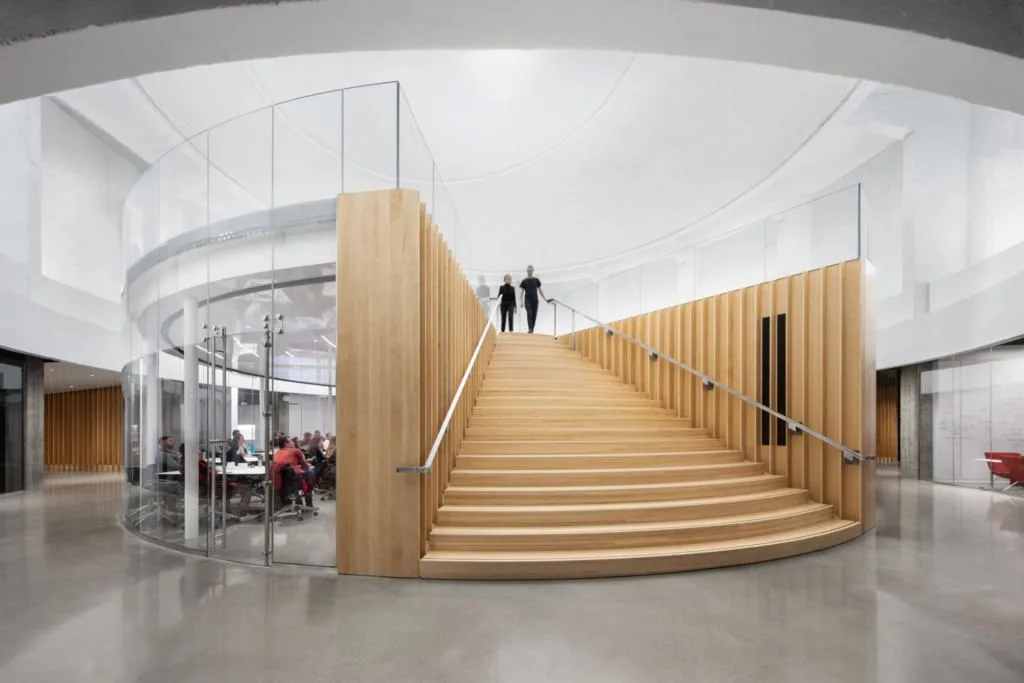
Picture of the Centech dome, taken from the ground floor. For this study, measurements were taken on the first floor.
On the first floor, the geometry is perfect for projecting a starry sky. However, the combination of the materials used and the configuration of the space generates acoustics that render the space practically unusable given the echoes and the long reverberation time. When the planetarium was active, this acoustics problem was not so apparent, since the center was used by the projection lens in a way that no sound was coming from or heard from this point.
Materials and techniques
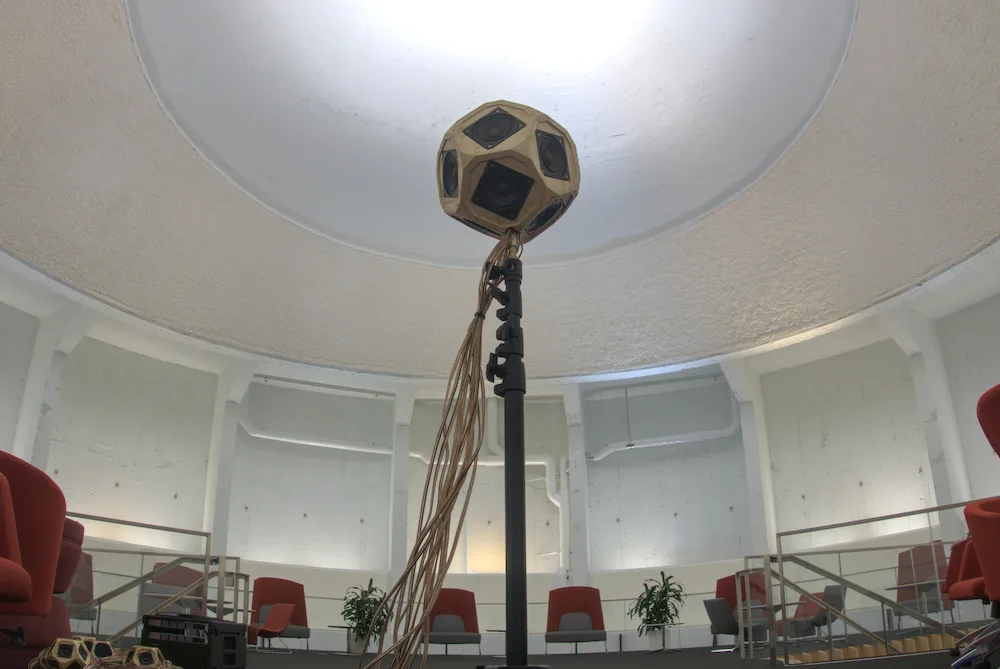
The acoustic description of a space can be done through the analysis of impulse responses. In acoustics, an impulse response is an audio recording of an impulse and its reverberation in the space currently being studied.
In the past, these impulse were generated by methods such as exploding a balloon, triggering a racing pistol or clapping your hands. The problem shared by all these methods is the ability to reproduce a sound. It is near impossible to obtain the exact same sound when clapping your hands, or exploding two different balloons; we will witness variations in frequency and power. As an example, two hands clap can differ in pitch, one being higher than the other.
The main technique used nowadays is frequency sweep with a sine wave. A speaker transmits a sine wave going from 20Hz to 20kHz (human hearing range) while a microphone captures the result. Through a convolution operation, we can transmit this frequency scan in one impulse in such a way that we use typical impulse response analysis tools. To generate this signal and to convert it to an impulse, we used the pyAmbIR software developed at Metalab. This tool enables the visualization of an ambisonic recording sound energy, allowing us to measure reverberation times.
In the current case, we used an omnidirectional speaker called the Audiodice (developed by Metalab) and a 3rd order ambisonic microphone. These tools allow us to gather spatial information on top of temporal information.
Measures
Impulse Response
For measuring, we installed the speaker at 50cm from the center, the microphone being diametrically opposed to the speaker. The space between the microphone and the speaker will be used later to install absorbing material. The microphone and the speaker were located at a height of 1,5m, on top of a tripod (around eye level).
A frequency sweep was played for 20s. The recording continues to run for another 20s after the sweep to caputure the reverb tail.This allows us to consider the reverberation time of the space. The choice made for the duration of the sweep is a compromise between capture time and the signal-to-noise ratio. Usually, we sweep for a duration of 3 to 20 seconds. The signal-to-noise ratio rises as the sweep speed slows down. This explains why we decided to pick a high limit. A longer recording time means that there will be much more background noise, putting the usability of the measure at risk. People coughing, a falling object or even a creaking chair are all noises heard during recording sessions.
Reverberation time is a measurement often used in acoustics to characterize a space in a simple manner. This measure is defined by the time it takes, in seconds, for acoustic energy to be reduced by a factor of a 1000 (30dB) or 1000000 (60dB). These are respectively called RT30 and RT60, where RT stands for Reverberation Time, the number corresponding to the factor selected for analysis.
Ambisonic impulse response analysis with pyAmbIR
PyAmbIR is a Python toolbox that is used to generate necessary signals for creating impulse responses and for the manipulation, the visualization and the analysis of ambisonic files.
The main use of this case study script is to link JACK audio inputs and outputs, the hard drive and NumPy together, the latter one allowing us to do convolution operations. The script is available in the examples/IR_recording.py folder in the PyAmbIR repo.
Here is the main loop of this script:
for measureName in plan:
    redo = True
    while redo:
        print("-------------------------------")
        print("Will measure: " + measureName)
        input("Press Enter when ready to record")

        # play / record sweep
        jack_env.play_record(measureName)

        # check function docstring to obtain filter
        # A2B-Zylia-3E-Jul2020.wav
        convert_to_Bformat(measureName + ".wav",
                         "A2B-Zylia-3E-Jul2020.wav")

        # convert IR
        ess.deconv_ess(measureName + "_B.wav",
                       "IR_" + measureName + "_B.wav")

        print("-------------------------------")
        print("measurement finished")
        redoStr = input("redo ? y/N")

        if redoStr != "y":
            redo = False
A recording happens in three steps:
-
recording of the frequency sine sweep.
-
conversion to B format, an ambisonic format made from a microphone specific calibration file.
-
sine sweep to impulse conversion.
The ordering of these two last steps does not matter, since the convolution operation is commutative (like a multiplication).
To obtain the best possible results, silence must be total; this is why we suggest to make another measure if there was a noise during a recording. It is possible to interrupt a recording with CTRL-C key combination.
Results analysis
Here follows the result of this first ambisonic recording, which has been scaled down to an omnidirectional canal in order to ease its listening:
In this excerpt, we can hear the initial impulse and its reverberation. The measured RT30 is 13.57s; this means it takes 13.57s for the initial impulse energy to be reduced by a factor of 1000.
The following figure shows a waveform (in black) and the spectrum (in blue, green and yellow) of the impulse response. Here the horizontal axis measures amplitude and frequency, and the vertical one, the time.
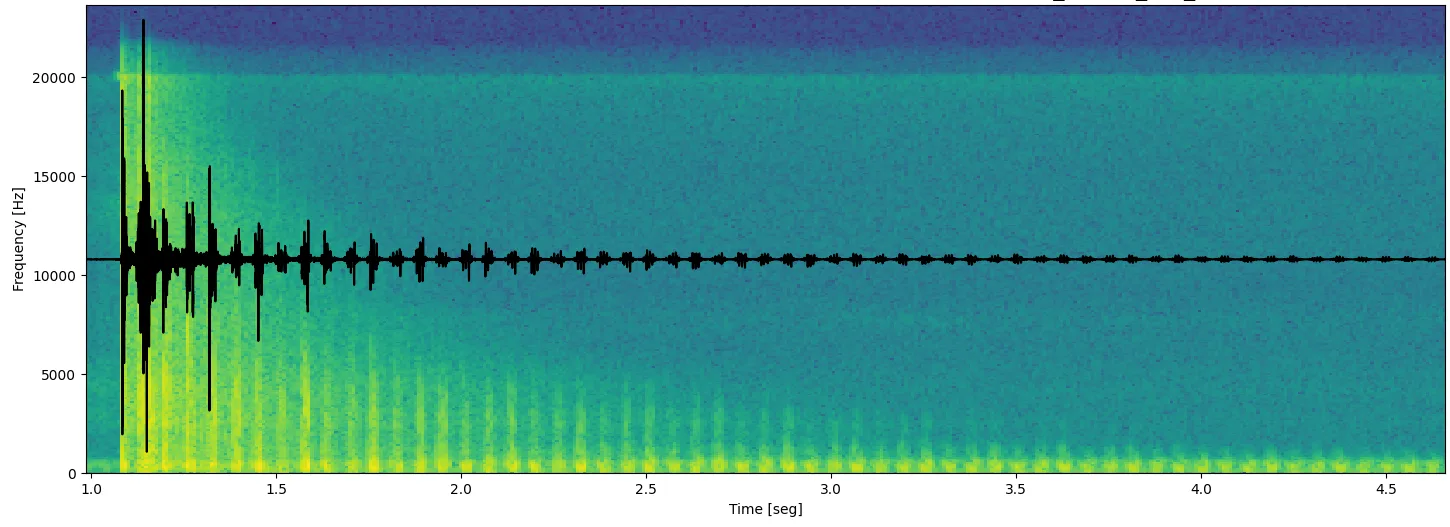
We can visualize the echo on the waveform; it is the sequence of regularly spaced peaks.
The first peak we witness is the direct sound. The second is its first reflection, stronger than the direct sound since the dome focuses all the acoustic energy from the omnidirectional speaker in a single point. For the direct sound, since only a part of the speaker faces the microphone, there is less directly transmitted energy. The next peaks are the following reflections between the dome and the ground. For each reflection there is an energy loss caused by absorption, diffraction, transmission, etc.
We can gather information about the quality of the reflections from the spectrum. Every reflection peak (in black) is mapped to a green/yellow column in the spectrum. We note that the height of these columns lowers as time passes, meaning that the lower frequencies are more persistent while the higher frequencies tends to dissipate faster. This is an often observed result in a room made of concrete.
Acoustic energy visualization
As we want to be able to tell where the sound is coming from, every recording was made with a 3rd order ambisonic microphone. An ambisonic microphone records sounds similarly to how a 360 degrees camera records an image: we don’t need to orient the device in a specific direction since it records every direction at the same time.
PyAmbIR proposes a visualization script for ambisonic recordings. We generate the following videos and images with this command line instruction:
$ python3 examples/visualize_ambisonic_IR.py -i examples/centech_center_3rd_order.wav -p examples/furniture_off.jpgOn an equirectangular 360 picture are layered the visualization of acoustic energy, the blue corresponding to a low level of energy and the yellow, to the highest level.
There is no sound in the video, the image being slowed down to help visualize energy movements. The video contains 1.5 seconds of recording, played back for 1 minute 34 seconds.

Color scale used for the visualization (from the Matplotlib library).
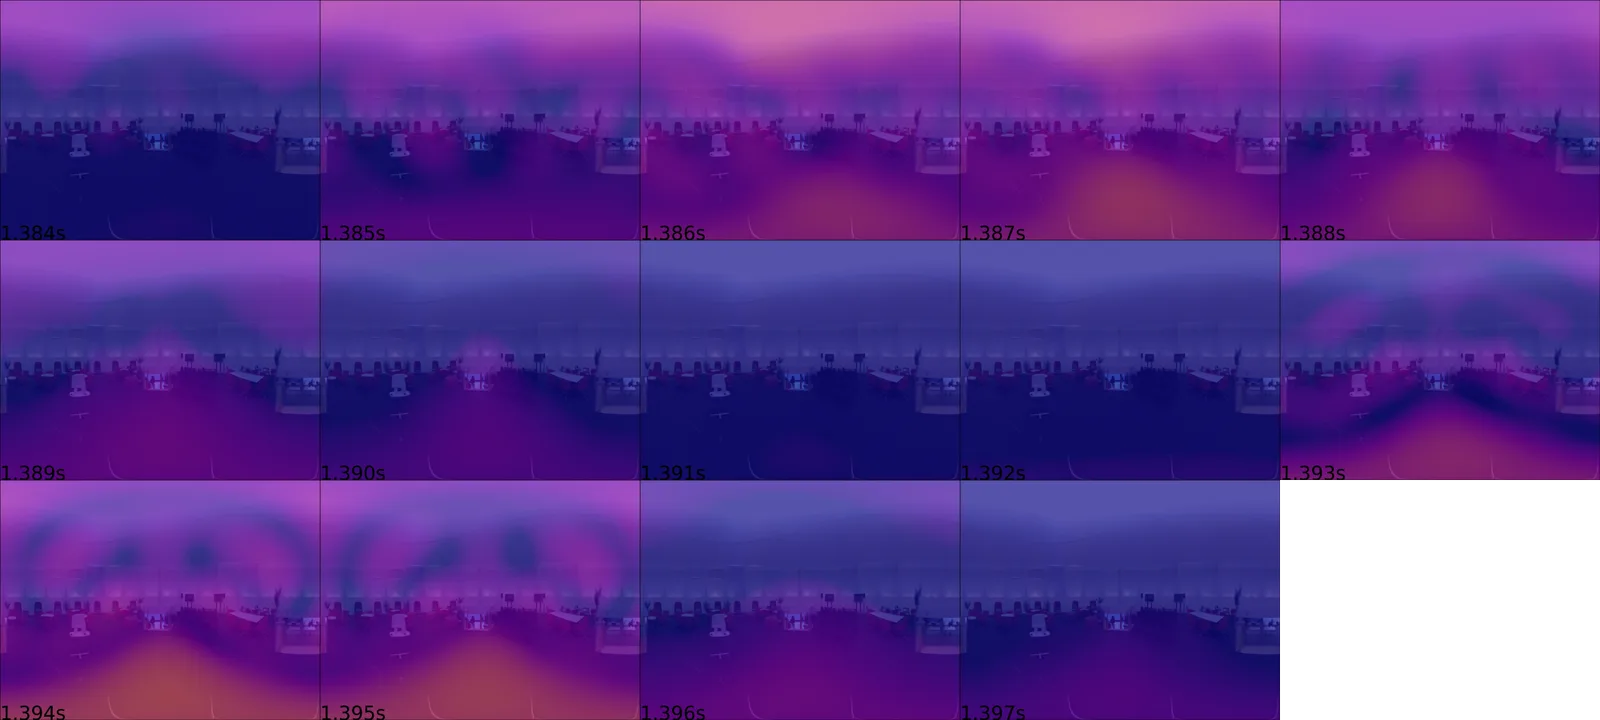
Video excerpt showcasing the back and forth of the acoustic energy, with no absorbing furniture.
The video begins with silence that precedes the impulse: the 360 picture is covered in blue. Then we see the center of the image turn to yellow: it is the direct sound emitted by the speaker. Next comes the first reflection, the sound coming from all places in the room: the image is completely covered in yellow and purple. As the video progress, we can see that the cylinder contribution gets smaller and smaller, before leaving the stage to the floor and dome reflections. These reflections are visible in the vertical movement of the yellow mass, as we can visualize in the image-by-image excerpt.
What we understood intuitively is now confirmed: the visualizations shows that the reflections happen mostly between the dome and the ground, the cylinder playing a less important role.
Acoustic focal point
The name of this phenomenon is acoustic focal point. In the same way that a concave mirror focuses rays of light in a single point (see the figure below), we can see that the dome acts like a spherical mirror for the sound, bringing the acoustic energy into a one and unique point.
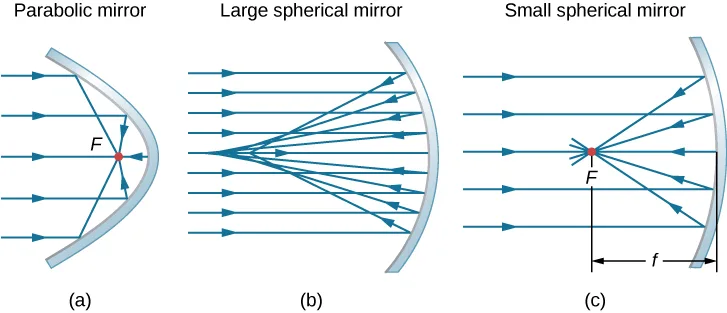
(CC image is from opentextbc.ca)
Absorbing material: installation
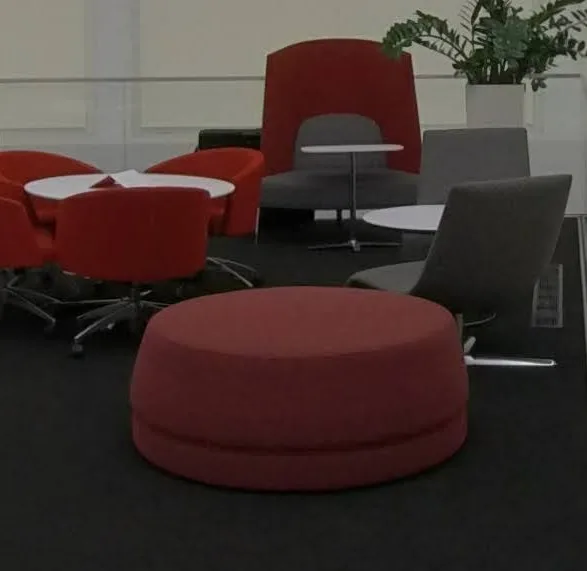
To reduce reverberation time, we need to absorb the acoustic energy to avoid reflections for too long. The focal point having been confirmed, we tried to position absorbing material at its location. A round seat made of wood, filled with foam and covered in red fabric was available to us. The diameter of this seat was about 1 meter and 45 centimeter high.
The position of the seat will impact the efficiency of the absorption. It is not enough to have absorbing material in the space to obtain an optimal absorption. The first impulse response showcased here was recorded with two of these seats in the space, at the center of the room.
With the goal of exploring these seats potential for sound energy absorption, we put one of them at the exact middle of the space before measuring the second impulse response. Recall that the center of the room is also the acoustic focal point.
When speaking of absorption, we have to consider that all frequencies are not absorbed in the same way by materials of different shape and size. As an example, we will need a bigger amount of material for lower frequencies than mid-level ones.
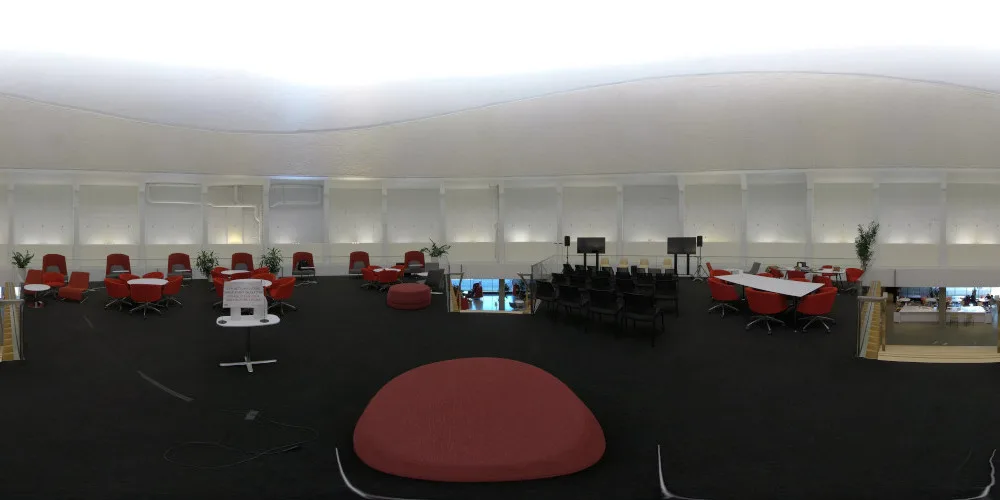
Equirectangular picture taken from the Centech dome center, when the absorbing furniture was installed at the focal point.
Here is the result of the recording featuring absorbing furniture. The recording process was the same as the one for the first measure.
We note a strong decrease in reverberation time, going from 13.57s to 2.97s, a factor of 4.569. Said differently, the sound resonates for about 4.6 longer when there is no seat at the acoustic focal point.
Below is the visualization of this recording, generated in the same way as before.
Results analysis
When it comes to estimating the sound quality of a space, the reverberation time is a good estimate. That being said, this measure is not generally detailed enough to help picking the right materials needed for an optimal absorption. To enhance our understanding, there is a simple method that consists in splitting the impulse response in multiple frequency range before computing the reverberation time.
This is what is shown in the figure belows, where impulse response where divided in eight strips of one octave starting from 20kHz: 20kHz - 10kHz / 10kHz - 5kHz / 5kHz - 2.5kHz / 2.5kHz - 1.25kHz / 1.25kHz - 625Hz / 625Hz - 312.5Hz / 312.5Hz - 156.25Hz / 156.25Hz - 78.1Hz. The value taken on the horizontal axis is the measured octave central frequency, while the value taken on the vertical axis is the RT30 duration in seconds.
We see two paths: the impulse response RT30 per octave (drawn as a continuous curve) and the impulse response RT30 on the whole set of frequencies (drawn as a dotted line).
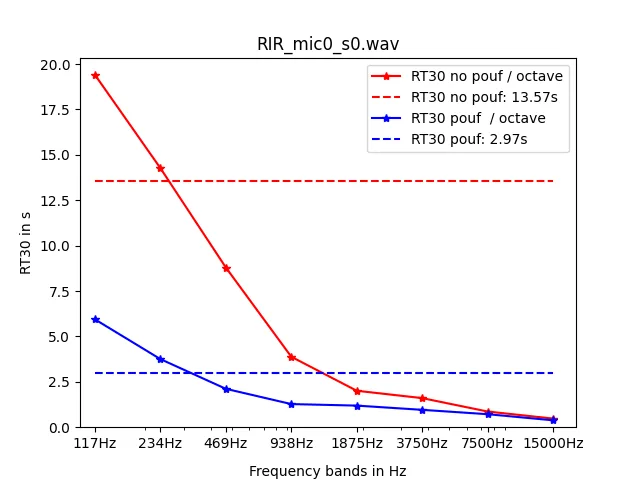
We confirm what we saw with the first capture spectrum: higher frequencies resonates less than the lower ones. The first two measures (those centered at 117Hz and 234 Hz) are longer than the general RT30 measure, the algorithm struggling to identify the useful signal from the background noise. The signal-to-noise ratio is low, giving less reliable results.
Another thing we can see is the fact that the mitigation enabled by the seat is stronger in the lower frequencies, since this frequency range is more of a problem for reverberation, and also because the seat is a voluminous attenuator.
Conclusion
In this post, we saw how to characterize and identify an acoustic problem by using ambisonic impulse responses. This analysis allowed us to confirm our intuition regarding the acoustic focal point phenomenon and to take appropriate action. Installing furniture at the exact point where sound waves gathers enabled us to reduce by a factor of 4 the space reverberation time. This simple space configuration change helps create a more usable space, without having to lose its quite specific sound signature.
Links
pyAmbIR : Software used to record impulse responses.
Audiodice : Speaker used to recording impulse responses.
Centech : Where the analysis was done.
Published on 05/05/2022 by Thomas Piquet (tpiquet(at)sat.qc.ca)